This is the third of a series of 8 posts that ran
sporadically
from 4/18-7/24 of this year.
from 4/18-7/24 of this year.
I never posted #8 because I decided
to reprise the series for the new school year.
to reprise the series for the new school year.
I'm running all 8 posts on consecutive Mondays starting 8/28.
If
you're not a teacher and you're reading this,
let a teacher know.
let a teacher know.
I've
been in enough "inservice" sessions to guarantee that the
information in this series is better than most they'll be sitting through this
school year.
What happens when you teach an advanced course—AP or IB, for example? No matter what “level” your course is, if you include higher level thinking skills in assignments, how do you grade that in class?
There are times when the only appropriate way to grade an assignment is for the teacher—you—to grade the whole kit and caboodle. That doesn’t have to be very often.
I’ll present two examples of how you can use PowerPoint to make your life easier. I have used the first example, scientific graphing, in all my classes from 9th-12th grade.
The second example is from AP Biology. It will be part of next week's blog.
The good news is this: You don’t have to know much about science to appreciate the explanation of this grading technique. The model works in any content area where you have repeating assignment types—graphing, in example one—or complex assignments with high-level vocabulary—example two.
When you grade an assignment of a type that is frequently assigned, you should teach how to do that assignment early in the year. Teaching the process, allowing students to make a sample, and grading that sample is the best way to ensure consistent grading over time.
The images below are from the PowerPoint used to teach scientific graphing.
During instruction, the top slide in the next set of PowerPoint slides starts with a blank X-Y axis. Labels and other components appear at the proper locations, reinforcing the previous slides’ information.
Using an appropriate scale is emphasized. Pretty much the goal is to fill a piece of graph paper with the graph. Next producing the line that "is" the graph is described.
Most students think their graphs are "done" at this point. They are not!
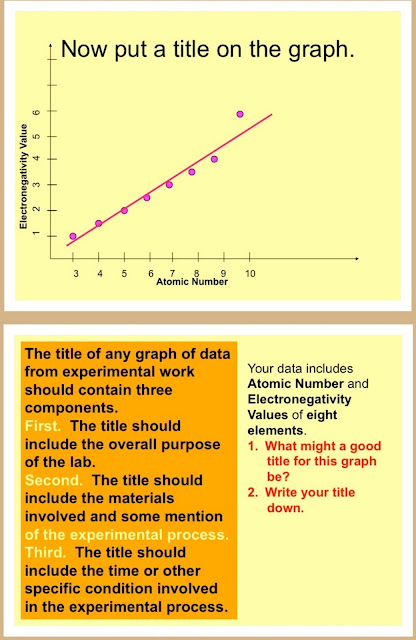
The title on a scientific graph is very important. It is worth one-third of the points for the graph. For that reason, an explanation of how to name a graph and why is critical, especially since graphs are often graded in class.
I apologize for the overlap of print in some images. That's because various items "appear" with a mouse click at specific times in the presentation.
Look at the image titled “Now put a title on the graph” in the pair above. The first text box to appear after the explanation of what information a title contains is, “The title should explain what you have graphed.”
Students discuss ideas for titles in pairs.
“For example: This title would be…” appears.
Last the actual title “Electronegativity Values of Selected Elements” appears in the proper location and the two previously visible text boxes disappear. This leads to the final slide.
 |
If a graph has multiple lines, a key is needed.
|
Students then are given time to make a graph and share it with their partners. They "grade" their graphs as practice.
After the first lab activity, students grade their own graphs.
They use the “grading pens” I mentioned in a previous blog for this grading. No pens or pencils except the grading pens are allowed during the grading.
During the grading time, slides appear in left to right, top row to bottom row.
Grading begins with the title.
The gray box containing the title appears after students have compared what they had on their graphs.
Students ask clarifying questions during the time the left slide in the bottom row is visible.
The last slide comes into view.
- Each “burst” appears in this sequence. Title. Y-axis. X-axis. Curve. Key. Yellow box.
- Students put the points earned in the same place on their graph as the “burst” for that feature appears on the screen.
- Questions are addressed. The teacher is the final arbitrator in any dispute.
- Points are totaled and written under the student's name on the graph.
- On “random” assignments, graphs are exchanged after grading. Scoring in authenticated by the new grader. Differences in scoring are resolved by the teacher before the papers are turned in. Not knowing when this will occur helps ensure honesty in the scoring.
- I check a set of graphs periodically, too. Again, this encourages the students to be honest in their assessments of point values.
This method does “take class time.” However, students learn from their errors while the teacher saves grading time for more complex assignments.
In the next blog in this series, I explain my method for peer grading of assignments with specific details required or that are based on “advanced” material.
Email me: EIT.DrD@gmail.com with questions/ comments.
Or, if you'd like more information or samples of anything described in this
series, send an email there!
The next Teachers. Thoughts on Grading will have still more on
homework.
Follow me on Twitter: @CRDowningAuthor and
Facebook: https://www.facebook.com/CRDowningAuthor
My website is: www.crdowning.com
I'd
appreciate your feedback!
Email me
at: chuckdowningauthor@gmail.com


No comments:
Post a Comment